The Coordinate Grid
Coordinate Plane
Two perpendicular number lines—the horizontal x-axis and vertical y-axis—meet at the origin \( (0,0) \). Locations are written as ordered pairs \( (x,y) \).
Key Characteristics:
- Horizontal x-axis shows left–right values.
- Vertical y-axis shows up–down values.
- Axes intersect at the origin \( (0,0) \).
- Each point is written as \( (x,y) \).
Example:
Plot \( (-2,3) \) — it sits in Quadrant II.
What Is Gradient?
Gradient (Slope)
Measure of a line’s steepness — how far it rises or falls for each unit you move right.
- Rise ÷ Run
- Positive: Upward tilt
- Negative: Downward tilt
Seeing Gradient
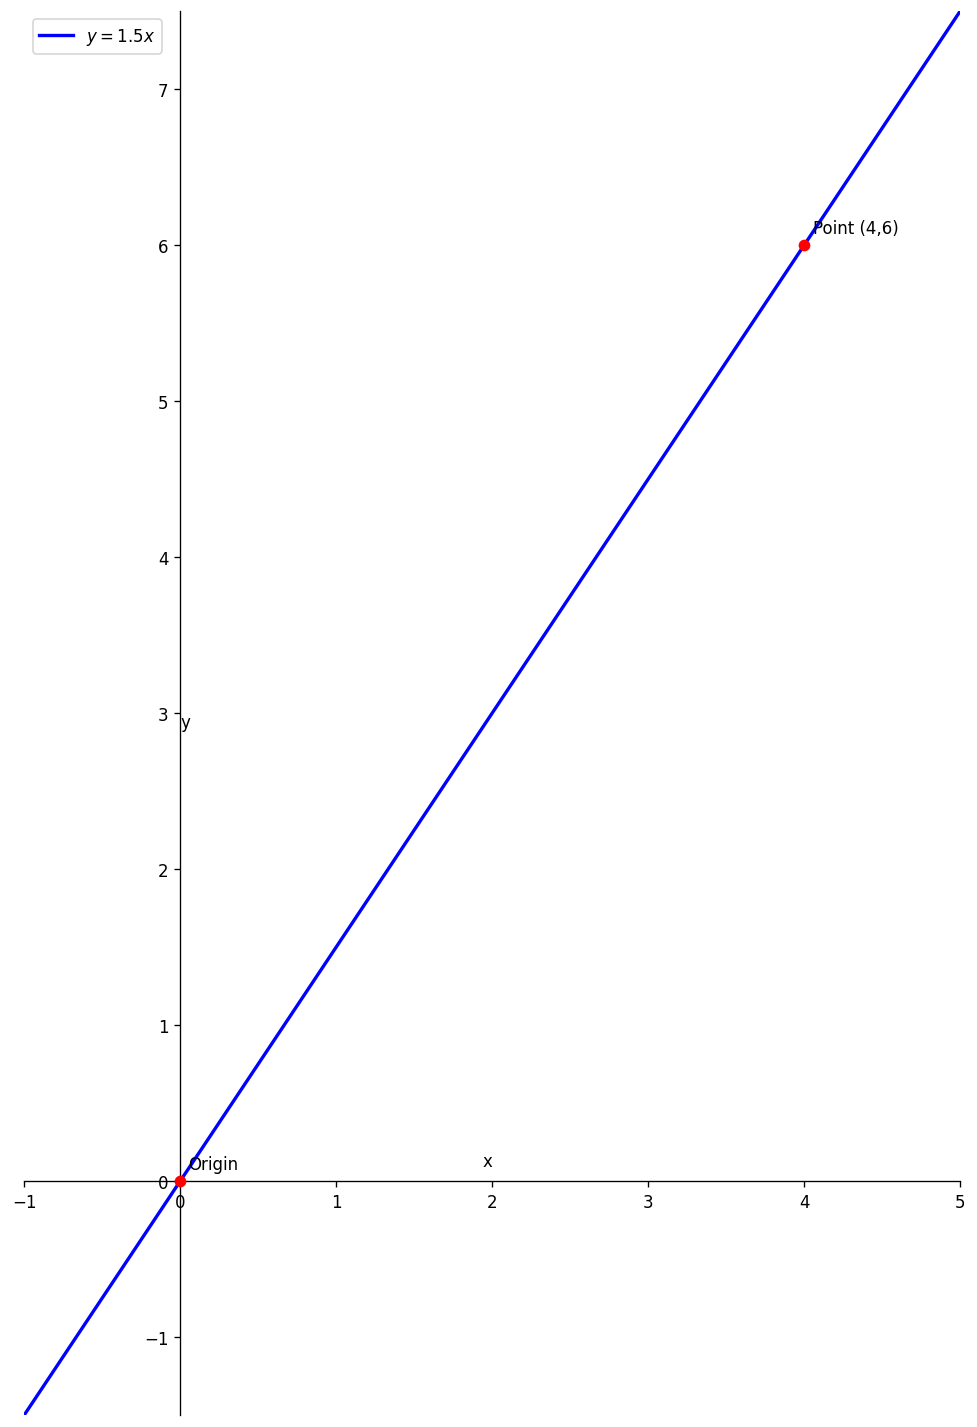
Arrows show 6-unit rise and 4-unit run.
Gradient = Rise ÷ Run
Vertical rise = 6 units; horizontal run = 4 units.
Therefore \( \text{gradient} = \frac{6}{4} = 1.5 \).
Key Points:
- rise = change in \(y\)
- run = change in \(x\)
- gradient shows line steepness
Gradient Formula
The slope formula uses any two distinct points on a non-vertical straight line; the ratio is constant.
Variable Definitions
Applications
Find slope
Calculate how steep a line is between two given points.
Write line equation
Use \(m\) with one point to form \(y = mx + c\).
Match Rise & Run
Active practice: drag each run number to the corresponding rise so the gradient \(m=\frac{\text{rise}}{\text{run}}\) is correct.
Draggable Items
Drop Zones
Rise 2, m = 1/2
Rise 4, m = 2
Rise -3, m = -3
Rise 5, m = 1
Tip:
Remember: \(m=\frac{\text{rise}}{\text{run}}\). Swap rise or run to get the needed ratio.
Meet the Intercepts
x-Intercept
y-Intercept
Key Similarities
y = mx + c
Variable Definitions
Applications
Quick Sketch
Plot \(c\) on the y-axis, move with slope \(m\), draw the straight line.
Model Checking
Identify slope and intercept to test if data fits a straight-line equation.
Full Picture
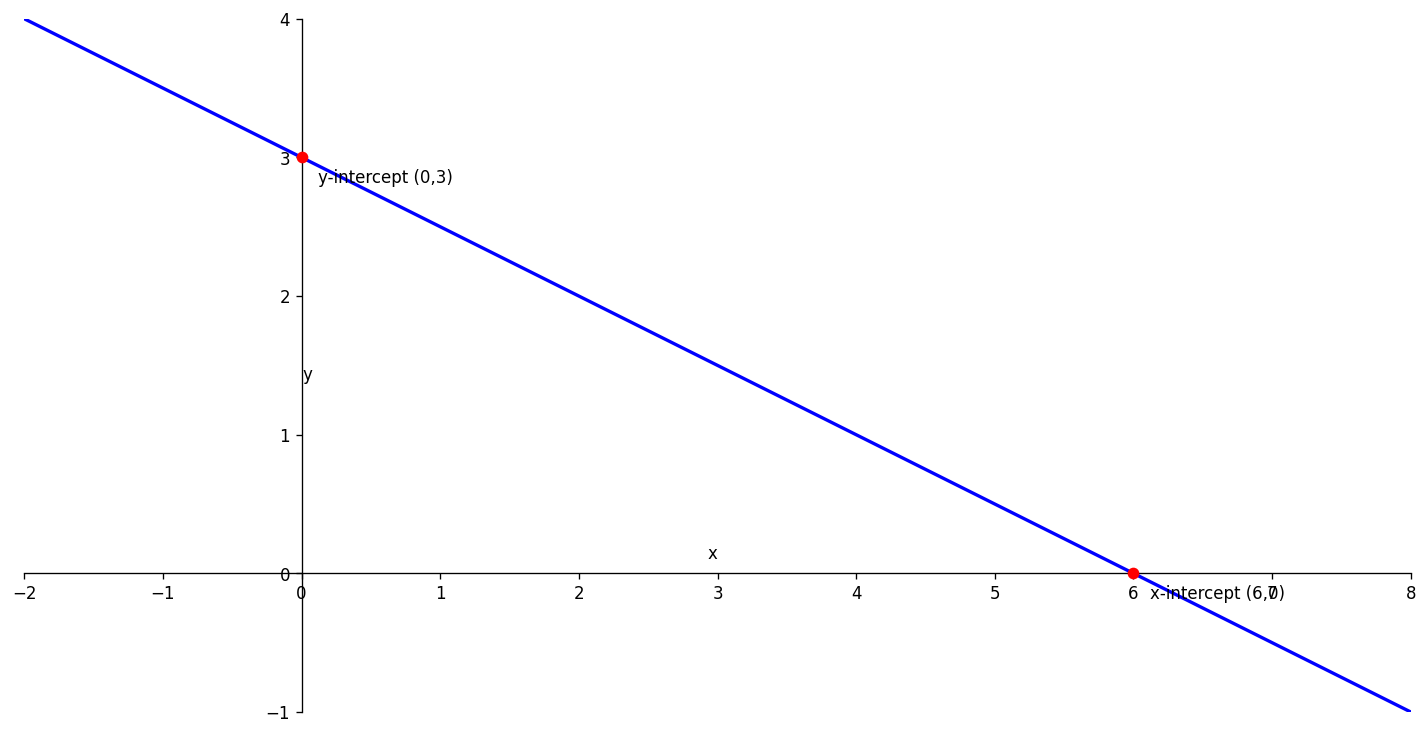
Line \(y = -0.5x + 3\)
Read the equation to pick out each intercept and the slope.
These values let you quickly place the line on the graph.
Key Points:
- Gradient \(m = -0.5\) (negative)
- y-intercept: set \(x = 0\) → point \((0, 3)\)
- x-intercept: set \(y = 0\) → solve \(0 = -0.5x + 3\) gives \(x = 6\); point \((6, 0)\)